Founded in 2008, Airbnb has been a blockbuster hit with the number of guest bookings skyrocketing throughout the 2010s as an alternative to traditional hotels. As it prepares to go public this year, we wanted to specifically focus in on the Austin market for Airbnb rentals as local SMEs (Subject Matter Experts. Since we live here too!) to determine what the unique "characteristics" of Austin Airbnbs are. Here, we analyze and present an open dataset from Inside Airbnb that includes a listing's cost per night, zip code, ratings, availability, and more.
Using Python, Tableau, AWS, Databricks, the John Snow Labs Spark NLP library, and Javascript libraries, we aim to present what makes Austin Airbnbs not only unique, but weird.
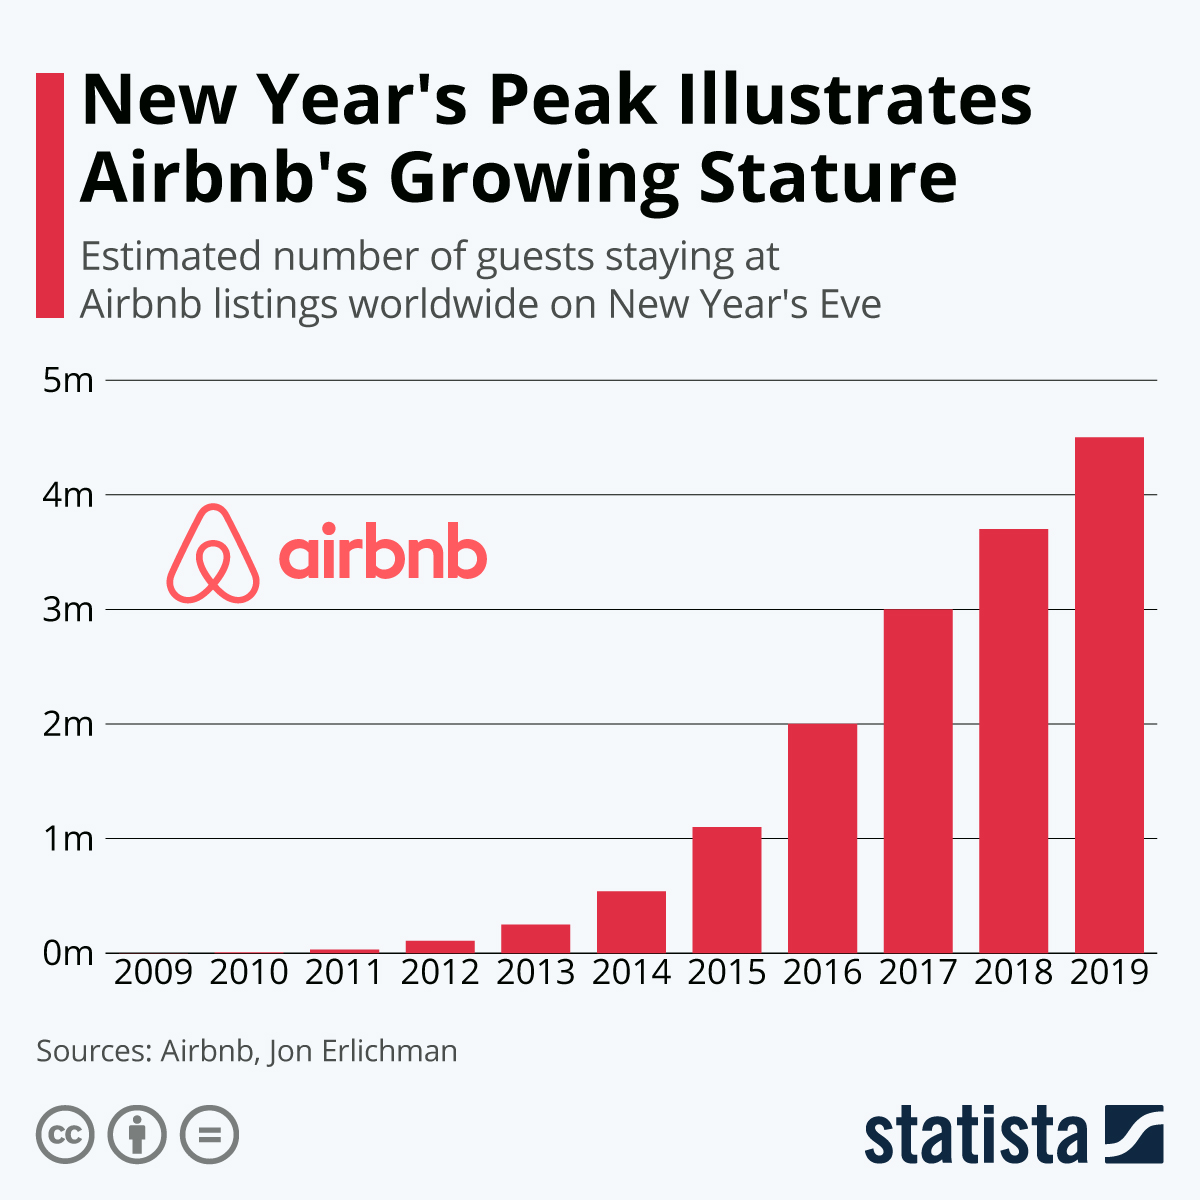
Fig.1 - Airbnb's Massive Growth from 2009-2019. Source
Data Insights
by Hazel & Hayley
These are basic charts and plots that we did to investigate certain details of the Austin Airbnb listings, such as property and room types by region, average fees, average number of guests, and minimum nights.
Below is a map made in Tableau to show the distribution of Airbnb listings' price level distributions across the Austin area. A helpful tooltip is provided to show metadata information about each listing and a reference link to the listing on the Airbnb site.
Sentiment Map
by Chris
The review data for the listings was loaded onto an AWS Postgres server and John Snow Lab's Spark NLP library was used to aggregate all of the reviews and assess each their general sentiment ("positive" or "negative") on a sentence by sentence level. After each review was analyzed, the sentiments were aggregated in various ways to assess the review's "overall" sentiment. Each aggregation could produce wildly different results so they were compared to the overall star rating of each listing as a measure of accuracy.
Note that Airbnb reviews are overwhelmingly positive (the average rating was about 4.8 stars in the dataset!) and each aggregation's results are as follows:
Vote Sentiment (positive if number of positive sentences > number of negative sentences)
16%
Highest Confidence Sentiment (sentiment of highest confidence level sentence in review)
82%
Longest Sentence Sentiment (sentiment of longest sentence in review)
47%
Classified Sentiment (distance function based on comparing lengths of positive vs negative sentences determines sentiment)
65%
As you can see, just taking the count of positive vs. negative sentences produced the worst result in terms of accuracy. Some tweaking can be done (it was found that there are weird interpretations of certain characters so text cleaning could be improved) but the John Snow Spark NLP library tends to unconfidently rate sentences as negative much of the time from what I could see. Taking the most confident sentence as rated by the library and then using that one to represent the overall review was the option with the best accuracy.
Fig.2 - Sentiment Map of Austin Airbnbs ("positive" vs "negative")
Word Clouds
by Chris
The text of the reviews were isolated and cleaned (with a lot of common words and stopwords like "a", "the", "and", etc. taken out). We were interested in seeing what words were most uniquely popular in reviews for each zipcode. During our first analysis, the word frequencies seemed very homogenous, with most reviews having the same few key words (like "clean" or "host" for example), which was not very helpful in determing what made each area unique. The text was cleaned, taking out these more common words, and we arrived at the final dashboard below. The word clouds and bar charts can be a useful indicator of what makes each zipcode a unique place to stay in.
The pipeline for the John Snow Spark NLP library was much like the one for the sentiment map, except that this time the pipeline was set up to tokenize sentences, remove stopwords, and determine both the most common unigram (single words) and bigrams (word pairings) that occurred in the text. Bigrams were considered as people tend to describe things in an adjective-noun pattern (such as "clean house" or "great host").
Note: Use the map to zoom in/pan for zipcodes in the Austin area but the zipcode must be selected in the dropdown menu to change plots.
Fig.3 - Unigrams Word Cloud
Fig.4 - Bigrams Word Cloud
Fig.5 - Top 10 Unigrams
Fig.6 - Top 10 Bigrams
Review Writer AI
by Nathan
A dataframe of all the reviews was also created, linked to the listing they were attached to as well as the average rating of that property. They were all separated into three buckets as determined by their rating:
Taking all the good ratings, we trained AI using textgenrnn on top of TensorFlow and Keras to write reviews based on our data. Unfortunately, we did not have enough time to train any AI besides the "good ratings" one since there were 69 million characters to train from and by the time we got to the "bad ratings" training, we realized there was 1000x less data in that set, and we would have to run it many more times.
What follows are snippets written by the "good ratings" AI with increasing settings of temperature (aka writing creativity). Smaller temperature values indicate that the AI follows its training more closely.
        ####################
        Temperature: 0.2
        ####################


        The house is spacious and clean. The bed was super comfortable and the place is a great place to stay in Austin.  The house is spacious and clean. The house was clean and cozy. The house is in a great location and very clean.  We were able to walk
        ####################
        Temperature: 0.5
        ####################


        ievine and the space was awesome! The house is in a great location for exploring Austin and want to stay in Austin and we would definitely stay here again. My boyfriend and I had a wonderful stay at the house. It's also a bit of a place to stay in a great location and close to everything in Austin
        ####################
        Temperature: 1.0
        ####################


        My husband and I attended the friend and he went out of his way to visit on shopping to all the Austin farex - clean, company and had good cassy giant in the eventing (and all the genek in the covering area I was really high & again when I get to the same channel trafficility was residential and qui
Future Analysis Directions
There are many future directions that we can take our analysis (especially if we had more data!):
A prediction of which hosts are superhosts and what are the most important factors to determine that status
More NLP analysis on other text fields, such as host description or listing description
Analysis of Airbnb Plus, Luxe, and Experiences
A study on the relationship between housing prices and Airbnb listings, if any
Using TF-IDF to better weight the frequencies of commonly occurring words
Detection of fake reviews (since we can already generate them)
SEO analysis of what listings make it to the top pages
Map of amenities (where am I most likely to find a hairdryer?)
Comparison of Airbnb vs hotel stays
Image classification of thumbnails (do they really have that pool they reported?)
Analysis of other cities' Airbnbs to compare to Austin
...the possibilities seem as endless as the amount of Airbnb listings!
 Up in the Air{bnb}